Help
General
- The data is generated from the APNIC FTP files, which is generated daily: https://ftp.apnic.net/public/stats/apnic/
- The data for the current year is updated daily.
- For previous data, the annual stats are taken as a snapshot at the end of every year. For more detailed information for that year, please check the APNIC FTP stats: https://ftp.apnic.net/public/stats/apnic/
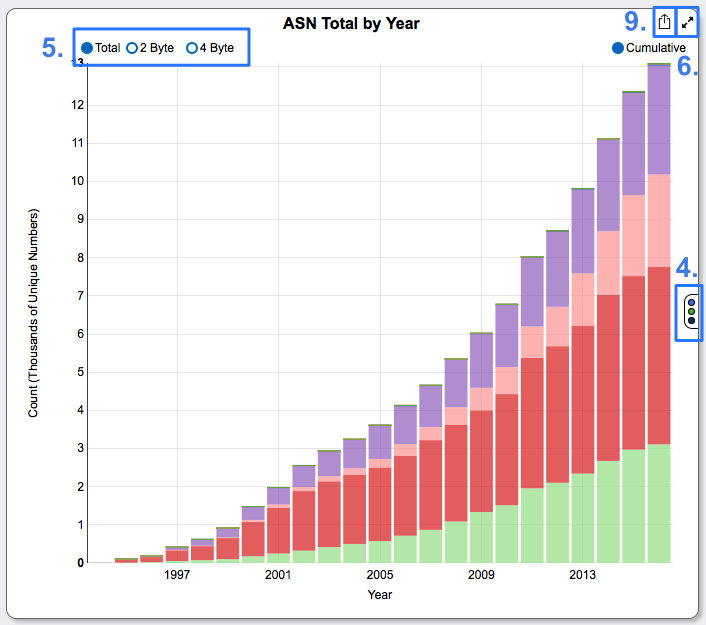
Navigation
- To view the legend, click the three dots to the right of the graph.
- You can change the way the data is shown by using the radio buttons.
- Each graph can be maximized for viewing.
- Moving the cursor over parts of the graph will show the values of the x and y axis.
- You can select to view the cumulative data.
- You can download the graphs in various formats including: pdf; png; svg; json; and csv.
- When viewing a particular resource (IPv4, IPv6 and ASN), a map view option will become available.
- You can drill down and view the data by sub-region as well as a specific economy.
- You can find useful links on the bottom left of the screen.